


Introduction to Mass Spectrometry
Contents of this introduction:
- GC/MS: a description of the instrument
- Interpreting Spectra: what information does a mass spectrum provide?
- Relative Abundance Isotope Table: isotope abundance for common elements
- Other methods: other mass spectrometry techniques are described
- Websites: where you can go for more mass spectrometry information
GC/MS
A mass spectrometer creates charged particles (ions) from molecules. It then analyzes those ions to provide information about the molecular weight of the compound and its chemical structure. There are many types of mass spectrometers and sample introduction techniques which allow a wide range of analyses. This discussion will focus on mass spectrometry as it's used in the powerful and widely used method of coupling Gas Chromatography (GC) with Mass Spectrometry (MS).
Pictured above is a GC/MS instrument used in the organic teaching labs.

Gas Chromatograph (GC)
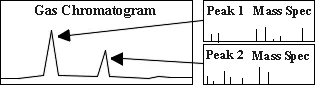
A mixture of compounds to be analyzed is initially injected into the GC where the mixture is vaporized in a heated chamber. The gas mixture travels through a GC column, where the compounds become separated as they interact with the column. The chromatogram on the right shows peaks which result from this separation. Those separated compounds then immediately enter the mass spectrometer.
Mass Spectrometer (MS)
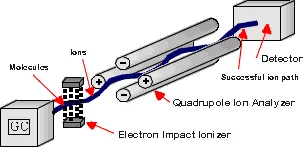
To the left is a general schematic of a mass spectrometer. The blue line illustrates ions of a particular mass/charge ratio which reach the detector at a certain voltage combination.
All mass spectrometers consist of three distinct regions.
1) Ionizer 2) Ion Analyzer 3) Detector
Ionizer
In the GC-MS discussed in this introduction, the charged particles (ions) required for mass analysis are formed by Electron Impact (EI) Ionization. The gas molecules exiting the GC are bombarded by a high-energy electron beam (70 eV). An electron which strikes a molecule may impart enough energy to remove another electron from that molecule. Methanol, for example, would undergo the following reaction in the ionizing region:
CH3OH + 1 electron ------> CH3OH+.+ 2 electrons
(note: the symbols +. indicate that a radical cation was formed)
EI Ionization usually produces singly charged ions containing one unpaired electron. A charged molecule which remains intact is called the molecular ion. Energy imparted by the electron impact and, more importantly, instability in a molecular ion can cause that ion to break into smaller pieces (fragments). The methanol ion may fragment in various ways, with one fragment carrying the charge and one fragment remaining uncharged. For example:
CH3OH+.(molecular ion) -----> CH2OH+(fragment ion) + H.
(or) CH3OH+.(molecular ion) -----> CH3+(fragment ion) + .OH
Ion Analyzer
Molecular ions and fragment ions are accelerated by manipulation of the charged particles through the mass spectrometer. Uncharged molecules and fragments are pumped away. The quadrupole mass analyzer in this example uses positive (+) and negative (-) voltages to control the path of the ions. Ions travel down the path based on their mass to charge ratio (m/z). EI ionization produces singly charged particles, so the charge (z) is one. Therefore an ion's path will depend on its mass. If the (+) and (-) rods shown in the mass spectrometer schematic were ‘fixed' at a particular rf/dc voltage ratio, then one particular m/z would travel the successful path shown by the solid line to the detector. However, voltages are not fixed, but are scanned so that ever increasing masses can find a successful path through the rods to the detector.
Detector
There are many types of detectors, but most work by producing an electronic signal when struck by an ion. Timing mechanisms which integrate those signals with the scanning voltages allow the instrument to report which m/z strikes the detector. The mass analyzer sorts the ions according to m/z and the detector records the abundance of each m/z. Regular calibration of the m/z scale is necessary to maintain accuracy in the instrument. Calibration is performed by introducing a well known compound into the instrument and "tweaking" the circuits so that the compound's molecular ion and fragment ions are reported accurately.
Interpreting Spectra
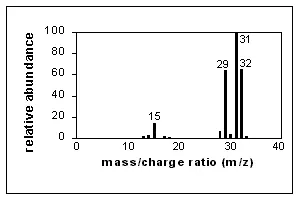
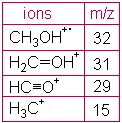
A simple spectrum, that of methanol, is shown here. CH3OH+. (the molecular ion) and fragment ions appear in this spectrum. Major peaks are shown in the table next to the spectrum. The x-axis of this bar graph is the increasing m/z ratio. The y-axis is the relative abundance of each ion, which is related to the number of times an ion of that m/z ratio strikes the detector. Assignment of relative abundance begins by assigning the most abundant ion a relative abundance of 100% (CH2OH+ in this spectrum). All other ions are shown as a percentage of that most abundant ion. For example, there is approximately 64% of the ion CHO+ compared with the ion CH2OH+ in this spectrum. The y-axis may also be shown as abundance (not relative). Relative abundance is a way to directly compare spectra produced at different times or using different instruments.
EI ionization introduces a great deal of energy into molecules. It is known as a "hard" ionization method. This is very good for producing fragments which generate information about the structure of the compound, but quite often the molecular ion does not appear or is a smaller peak in the spectrum.
Of course, real analyses are performed on compounds far more complicated than methanol. Spectra interpretation can become complicated as initial fragments undergo further fragmentation, and as rearrangements occur. However, a wealth of information is contained in a mass spectrum and much can be determined using basic organic chemistry "common sense".
Following is some general information which will aid EI mass spectra interpretation:
Molecular ion (M .+): If the molecular ion appears, it will be the highest mass in an EI spectrum (except for isotope peaks discussed below). This peak will represent the molecular weight of the compound. Its appearance depends on the stability of the compound. Double bonds, cyclic structures and aromatic rings stabilize the molecular ion and increase the probability of its appearance.
Reference Spectra: Mass spectral patterns are reproducible. The mass spectra of many compounds have been published and may be used to identify unknowns. Instrument computers generally contain spectral libraries which can be searched for matches.
Fragmentation: General rules of fragmentation exist and are helpful to predict or interpret the fragmentation pattern produced by a compound. Functional groups and overall structure determine how some portions of molecules will resist fragmenting, while other portions will fragment easily. A detailed discussion of those rules is beyond the scope of this introduction, and further information may be found in your organic textbook or in mass spectrometry reference books. A few brief examples by functional group are described (see examples).
Isotopes: Isotopes occur in compounds analyzed by mass spectrometry in the same abundances that they occur in nature. A few of the isotopes commonly encountered in the analyses of organic compounds are below along with an example of how they can aid in peak identification.
Relative Isotope Abundance of Common Elements:
|
Element |
Isotope |
Relative Abundance |
Isotope |
Relative Abundance |
Isotope |
Relative Abundance |
|---|---|---|---|---|---|---|
| Carbon | 12C | 100 | 13C | 1.11 | ||
| Hydrogen | 1H | 100 | 2H | 0.016 | ||
| Nitrogen | 14N | 100 | 15N | 0.38 | ||
| Oxygen | 16O | 100 | 17O | 0.04 | 18O | 0.20 |
| Sulfur | 32S | 100 | 33S | 0.78 | 34S | 4.40 |
| Chlorine | 35Cl | 100 | 37Cl | 32.5 | ||
| Bromine | 79Br | 100 | 81Br | 98.0 |
Methyl Bromide: An example of how isotopes can aid in peak identification.
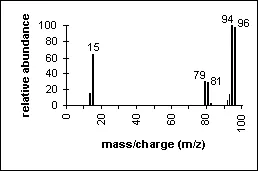
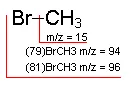
The ratio of peaks containing 79Br and its isotope 81Br (100/98) confirms the presence of bromine in the compound.
Other Methods
An array of ionization methods and mass analyzers are available to meet the needs of many types of chemical analysis. A few are listed here with a highlight of their usefulness.
Sample introduction/ionization method:
| Ionization Method | Typical Analytes | Sample Introduction | Mass Range | Method Highlights |
|---|---|---|---|---|
| Electron Impact (EI) | Relatively Small Volatile | GC or liquid/solid probe | to 1,000 Daltons | Hard method, versatile, proves structure info |
| Chemical Ionization (CI) | Relatively Small Volatile | GC or liquid/solid probe | to 1,000 Daltons | Soft method, molecular ion peak [M+H]+ |
| Electrospray (ESI) | Peptides, Proteins, Nonvolatile | Liquid Chromatography or Syringe | to 200,000 Daltons | Soft method, ions often multiply charge |
| Fast Atom Bombardment (FAB) | Carbohydrates, Organometallics, Peptides, Nonvolatile | Sample mixed in viscous matrix | to 6,000 Daltons | Soft method, harder than ESI or MALDI |
| Matrix Assisted Laser Desorption (MALDI) | Peptides, Proteins, Nucleotides | Sample mixed in solid matrix | to 500,000 Daltons | Soft method, very high mass |
Mass Analyzers:
Analyzer
Quadrupole
Sector (Magnetic and/or Electrostatic)
Time-of-Flight (TOF)
Ion Cyclotron Resonance (ICR)
System Highlights
Unit mass resolution, fast scan, low cost
High resolution, exact mass
Theoretically, no limitation for m/z maximum, high throughput
Very high resolution, exact mass, perform ion chemistry
Linked Systems:
GC/MS: Gas chromatography coupled to mass spectrometry
LC/MS: Liquid chromatography coupled to electrospray ionization mass spectrometry
Useful Websites:
A library of spectra can be found in the NIST WebBook, a data collection of the National Institute of Standards and Technology.
Useful tools such as an exact mass calculator and a spectrum generator can be found in the MS Tools section of Scientific Instrument Services webpage.
The JEOL Mass Spectrometry website contains tutorials, reference data and links to other sites.
Many more interesting and useful links can be found by following the site links in the above references.